By Month
Overview
This screen lets you check the usage details of Pleasanter by month. You can filter up to one year by specifying a "Start Year and Month" and an "End Year and Month". The detail information is displayed in ascending order of "Year and Month". You can also move to the Usage Details: By Day screen by clicking the link on "Year and Month" in the detail information.
Note
"Number of API Requests" can be checked only when you use the System Log Extended Function.
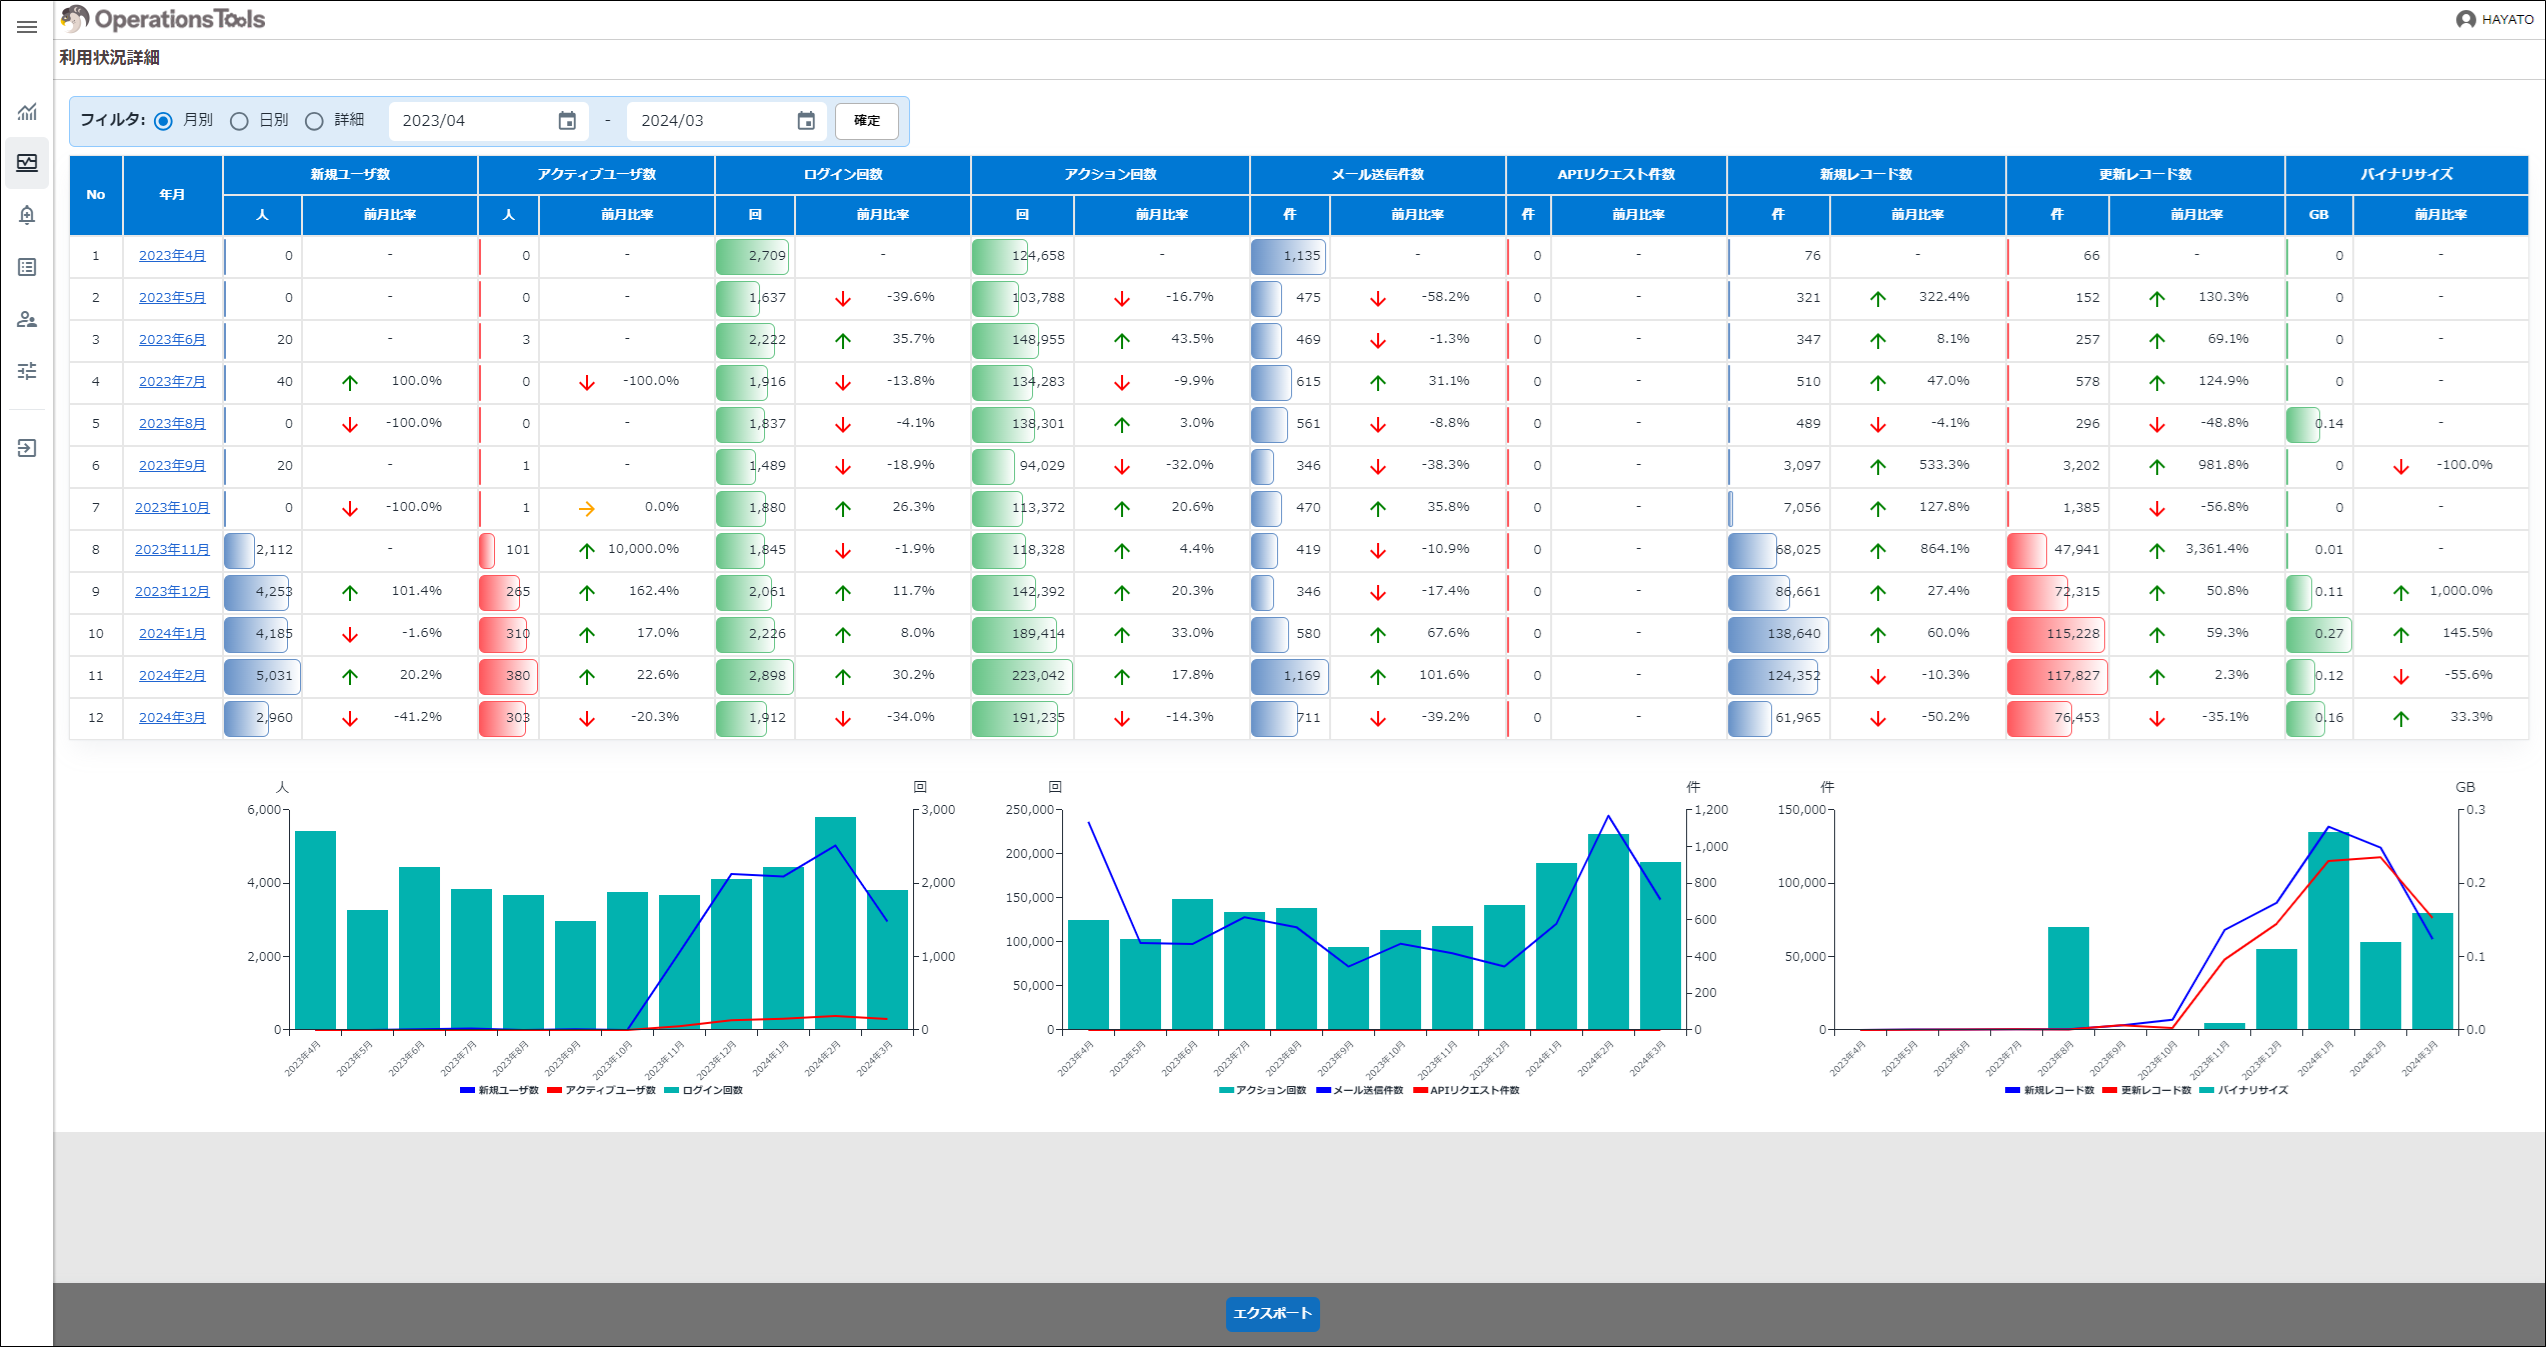
| Display Type | Column | Description |
|---|---|---|
| Table format | General | The usage within the period filtered by "Start Year and Month" and "End Year and Month" is displayed by month. |
| Table format | Number of New Users | The number of users newly registered within the period filtered by "Start Year and Month" and "End Year and Month" is displayed. |
| Table format | Number of Active Users | The number of users who logged in within the period filtered by "Start Year and Month" and "End Year and Month" is displayed. |
| Table format | Number of Logins | The number of user logins within the period filtered by "Start Year and Month" and "End Year and Month" is displayed. |
| Table format | Number of Actions | The number of all actions (the number of Syslogs records) within the period filtered by "Start Year and Month" and "End Year and Month" is displayed. |
| Table format | Number of Sent Mails | The number of mails sent within the period filtered by "Start Year and Month" and "End Year and Month" is displayed. |
| Table format | Number of API Requests | The number of API requests within the period filtered by "Start Year and Month" and "End Year and Month" is displayed. |
| Table format | Number of New Records | The number of new records within the period filtered by "Start Year and Month" and "End Year and Month" is displayed. |
| Table format | Number of Updated Records | The number of updated records within the period filtered by "Start Year and Month" and "End Year and Month" is displayed. |
| Table format | Binary Size | The binary size (the size of attached files, pasted images and so on) within the period filtered by "Start Year and Month" and "End Year and Month" is displayed. |
| Table format | Ratio to the Previous Month | The increase or decrease against the previous month is displayed as a percentage. |
| Graph | General | The results aggregated by month within the period filtered by "Start Year and Month" and "End Year and Month" are displayed as a combination of a line graph and a bar graph. |