Process Diagram Display
Overview
This page explains the process visualisation function of Pleasanter Site Visualizer. It visualises the processes set on a site of the Pleasanter you are logged in to (status transitions, buttons, data changes, notifications, permissions and so on) in two kinds of diagram: a flow diagram and a process diagram.
Process visualisation in Pleasanter Site Visualizer
A process is a function that is associated with a button displayed on the editor screen of a table and defines the status change, data change, notification and so on that happen when it is clicked. This screen visualises the process structure in the following two representations.
- Flow diagram:
With rectangles (nodes) that represent statuses and arrows (edges) that represent transitions, you can see the status transitions. - Process diagram:
Displays the processes in a swimlane-like format, with the source status on the vertical axis and the destination status on the horizontal axis. You can see the whole picture of the buttons and their relationships.
The screen consists of three blocks: the "left panel (process selection)", the "flow diagram" and the "process diagram". The flow diagram and the process diagram are displayed one above the other.
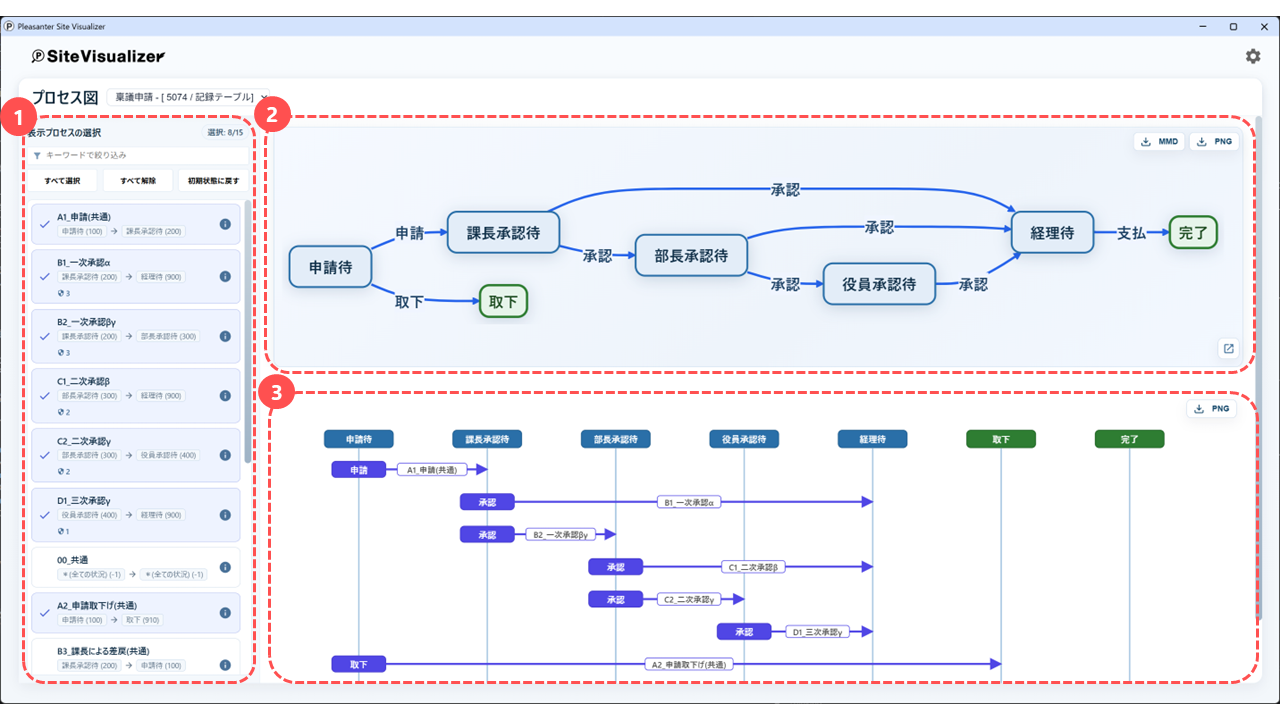
The role of each block is as follows.
| No | Block | Role |
|---|---|---|
| 1 | Left panel (process selection) | Switches what is displayed, from the list of the processes that are set. (For details, refer to 2-1) |
| 2 | Flow diagram (upper) | With rectangles that represent statuses and arrows that represent transitions, you can see the direction of the transitions between statuses and their conditions. (For details, refer to 2-2) |
| 3 | Process diagram (lower) | Displays the processes in a swimlane-like format, with the source status on the vertical axis and the destination status on the horizontal axis, so that you can see the whole picture of the buttons and their relationships. (For details, refer to 2-2) |
In the left panel, each process is listed as a card called a "process panel". An example of a process panel and the meaning of each element are as follows.

| No | Element | Description |
|---|---|---|
| 1 | Process name | Displays the name displayed of the process (the name when it is not set, and the ID when neither is set). |
| 2 | Checkbox | Switches whether the process is shown in the flow diagram and the process diagram. |
| 3 | Source -> Destination | Displays the "current status" -> "status after the change" of the process. The value in brackets is the status value (ID). |
| 4 | Notification icon | Displayed when the process has notification settings. The number on the right is the count, and you can see the content in a tooltip. |
| 5 | Permission icon | Displayed when the process has access control settings (group / department / user). The number on the right is the count. |
| 6 | The ⓘ icon | When you click it, the detail modal of the process opens (refer to 3-1). |
Limitations
- The flow diagram and the process diagram are drawn automatically based on the information in the table. Therefore, users cannot control where the objects and the arrows are drawn.
- When forward and backward transitions are drawn at the same time in the process diagram, the number of displayed items increases and it can become hard to grasp the information. Narrow down what is displayed according to your purpose.
Prerequisites
- "Site management permission" is required.
1. Operation Steps (the popup)
- Log in as a user with site administrator permission.
- Move to the site whose processes you want to check.
-
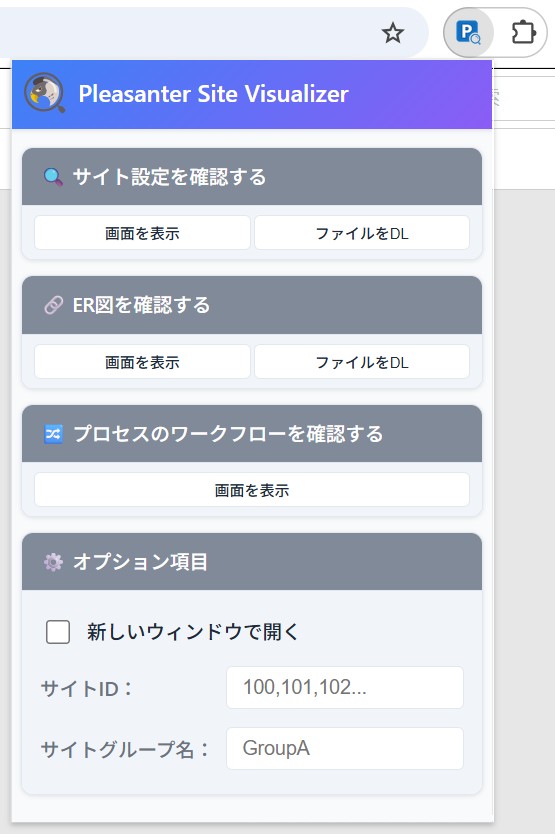
Click the Pleasanter Site Visualizer browser extension icon.
Icon State Description 
When the icon is blue, you can use it. 
When the icon is grey, you cannot use it. (This is the state when you are not logged in, or when the page you have open cannot open site management.) -
The operation screen of Pleasanter Site Visualizer is displayed.
2. Operation Steps (displaying the screen)
- Click "Show screen" under "Check the workflow of the processes".

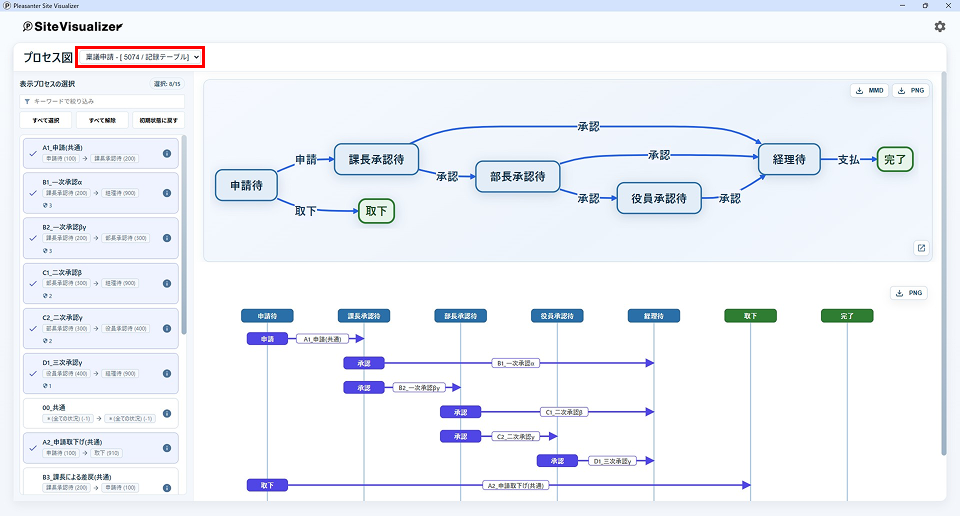
- The "process screen" opens. You can switch the table displayed with the dropdown list at the top of the screen.
2-1. Left panel (process selection)
The list of the processes that are set is displayed. By turning the checkbox of a process panel on and off, you can switch whether it is shown in the process diagram.

| Element | Function |
|---|---|
| The "Filter by keyword" text box | Narrows down the processes by process name. |
| The "Select all" button | Makes all the processes displayed. |
| The "Clear all" button | Hides all the processes. |
| The "Reset to the initial state" button | Returns to the initial state, in which only the forward transitions are selected. |
About the default process selection
Only processes whose status value after the change is greater than the status value before the change (forward transitions) are selected. Backward transitions and self transitions are not selected.
2-2. Flow diagram and process diagram
The flow diagram and the process diagram are displayed one above the other on the right of the screen.
- Upper: the flow diagram (normal display) — Displays the transition relationships with statuses and transition arrows. The direction of an arrow shows the direction of the transition; forward transitions are shown as solid blue lines and backward and self transitions as dashed red lines. When more than 24 processes are selected in the left panel, several arrows that have the same combination of source and destination are merged into one and the label shows "N items". Note that the threshold of 24 is a fixed value inside this function and cannot be changed.

- Lower: the process diagram — Displays the processes in a swimlane-like format, with the source status on the vertical axis and the destination status on the horizontal axis.

The buttons placed on each diagram are explained in the table below.
| Icon | Button Name | Position | Function |
|---|---|---|---|
 | Show the whole diagram | Upper | Enlarges the flow diagram in the "whole diagram modal" (refer to below). |
 | Save the flow diagram as MMD | Upper | Downloads the flow diagram as a text file in Mermaid format (.mmd) (refer to below). |
 | Save the flow diagram as PNG | Upper | Downloads the flow diagram as a PNG image (refer to below). |
| Save the process diagram as PNG | Lower | Downloads the process diagram as a PNG image (refer to below). |
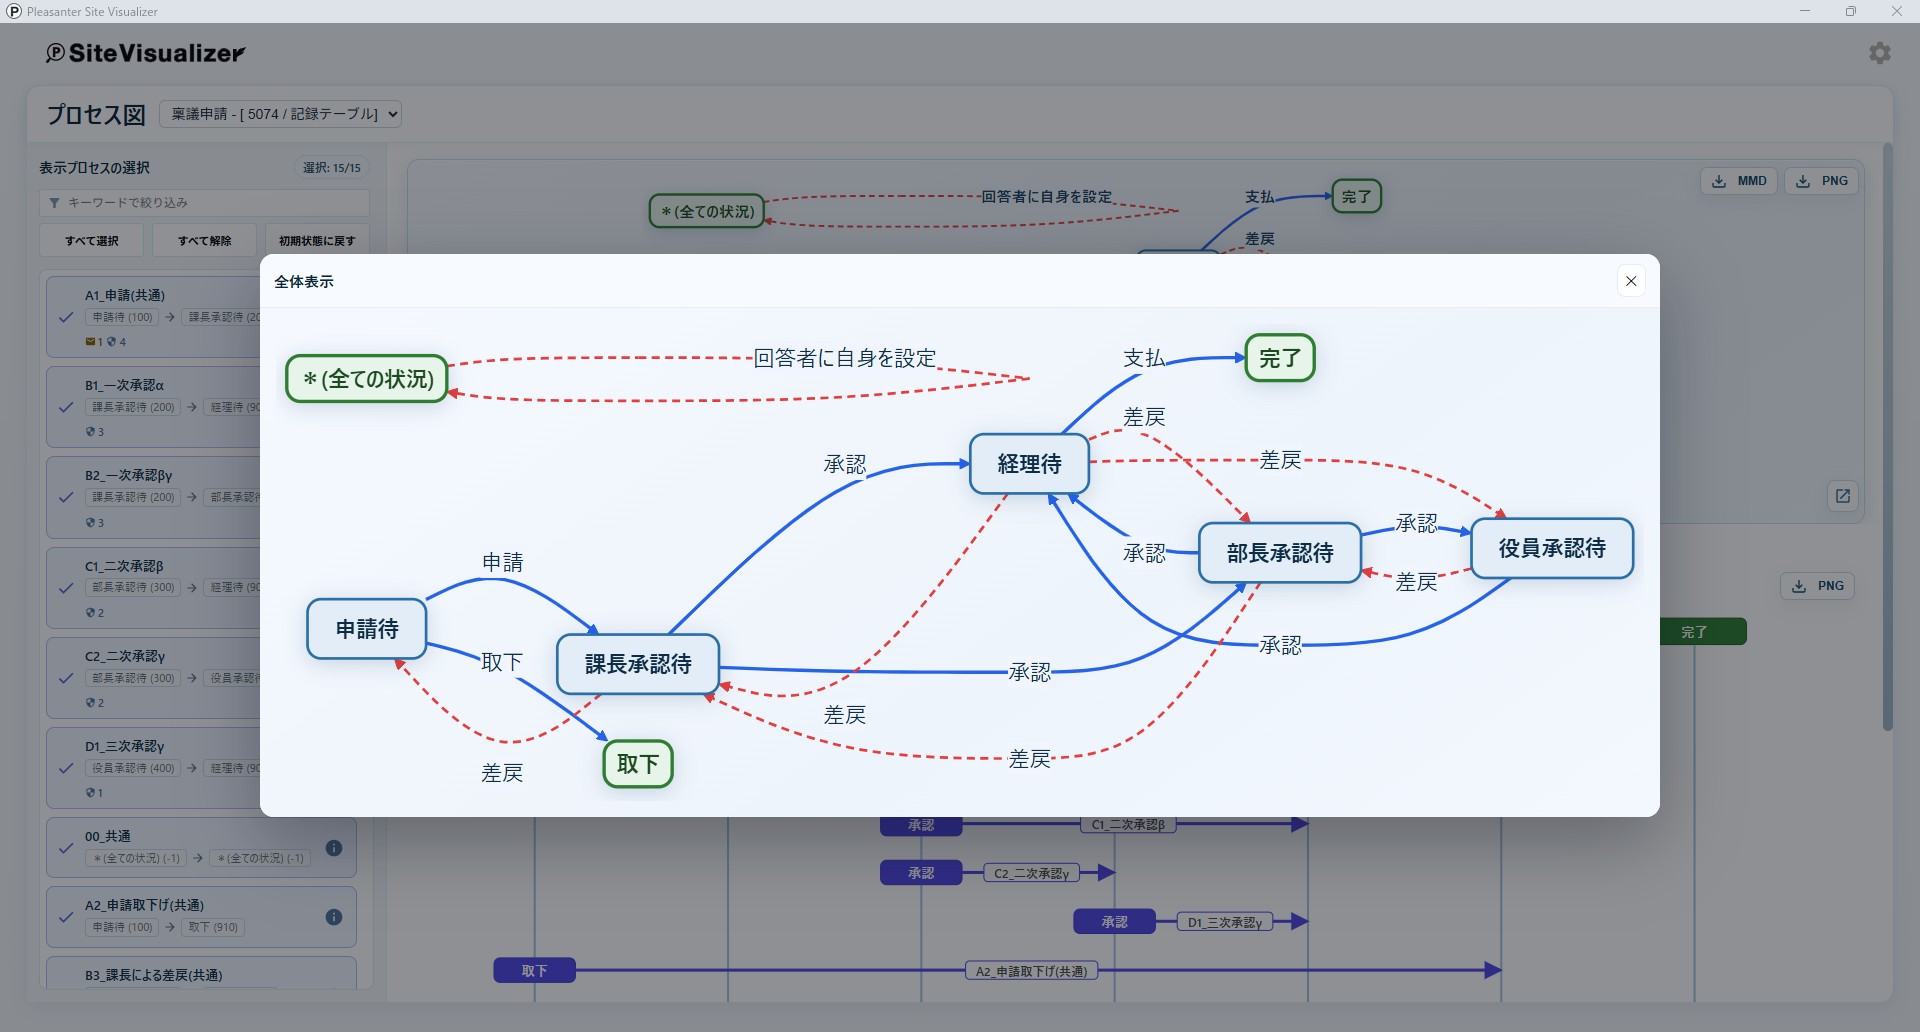
The "whole diagram modal"
When you click the "Show the whole diagram" icon of the flow diagram, the flow diagram whole view modal opens. In the whole view modal, every arrow is displayed individually without merging.
The "Output MMD text" dialog
When you click the "Save the flow diagram as MMD" button, the output MMD text dialog opens.

| Option | Effect |
|---|---|
| Output the whole diagram | Outputs an .mmd file that includes every arrow, even when there are more than 24 processes. |
You can preview the downloaded .mmd file in tools such as the Mermaid Live Editor, and you can also make use of it by embedding it in a Markdown document as a code block.
The "Output PNG image" dialog
When you click the "Save the flow diagram as PNG" or "Save the process diagram as PNG" button, the output PNG image dialog opens.
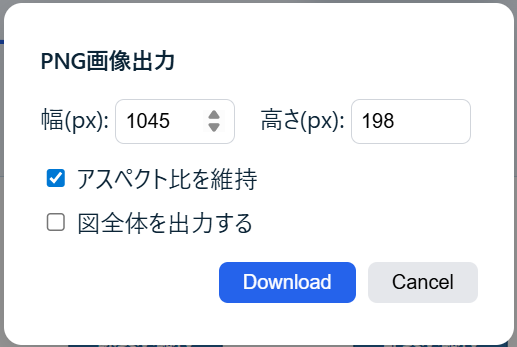
In this dialog you can specify the width and height of the PNG image to output.
| Option | Effect |
|---|---|
| "Width (px)" and "Height (px)" | Specify the output size. If you enter a non-numeric value or leave it blank, the initial value is applied. |
| Check "Keep the aspect ratio" | The aspect ratio is kept, so that when you change one the other is calculated automatically. |
| Check "Output the whole diagram" (the flow diagram only) | Outputs a .png file that includes every arrow, even when there are more than 24 processes. |
When the size is extremely large, an error message is displayed and the image is not generated.

3. Operation Steps (the detail display)
You can display the detailed information of a process in a modal.
3-1. Triggers for the detail display
The detail modal opens with either of the following operations.
- Click a process button on the process diagram
- Click the ⓘ icon next to a process name in the left panel
3-2. Content of the detail modal
Based on the settings of the process, the detail modal displays the following sections.

| Section | Content |
|---|---|
| General | The basic information of the process (ID / name / name displayed / screen type / current status / status after the change / description / tooltip / icon / confirmation message / success message / behaviour on click / execution type / action type / behaviour after the status change / allow bulk processing) |
| Input validation | The input validation rules when the process is run |
| Conditions | The conditions for running the process (incomplete / mine / deadline approaching / delayed / overdue / search / column list) |
| Data change | The data change rules when the process is run (change type / copy source / value / formula / base date and time / period and so on) |
| Auto numbering | The auto numbering settings (format / reset type / default value / step) |
| Notification | The notification settings (notification type / subject / address / Cc / Bcc / token / content) |
| Access control | The permission settings (group / department / user) |
The setting values are displayed converted into labels (for example the screen type is displayed as "Edit" and the notification type as "Mail").
4. Switching Between Several Sites
When you specify several IDs in "Site ID", or a site group name in "Site group name", in the "optional columns" of the popup screen and then run "Show screen", you can switch the site displayed with the site selector (the dropdown) at the top of the screen.


- Tables other than record tables and tables with a deadline (such as Wiki) are not shown in the selector.
- It is not shown in the dropdown menu when you do not have "site management permission".
Supported Versions
| Supported Version | Description |
|---|---|
| Pleasanter 1.5.4.0 and later | Newly created |