Table Function: Record Progression Rate
Overview
The "Progression Rate" on the record "Index screen" shows the following information.

Using the "Progression Rate" (a percentage) entered by the user together with the bar charts generated automatically from other information, you can compare plan and actual on a date basis.
1 Progression Rate
Shows the value (a percentage) that the user entered in the "Progression Rate" column.
2 Planned bar chart
A bar chart showing the proportion of the period from "Start" to the current date, against the period from "Start" to "Completion".
- The planned bar chart is always shown.
- The period from "Start" to "Completion" is shown as a light grey bar.
- The period from "Start" to the current date is shown as a dark grey bar.
- If "Start" is not set, "Created Time" is used instead.
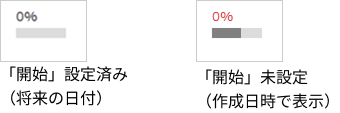
3 Actual bar chart
A bar chart showing the current progression rate.
- The actual bar chart appears once the user sets a "Progression Rate".
- When progress is "ahead" of the elapsed dates, the bar is green.
- When progress is "behind" the elapsed dates, the bar is red.

Customizing the progression rate display
For customizing the progression rate display, see the following FAQs.
- FAQ: Automatically specify the progression rate based on the status column value
- FAQ: I want to hide the bar chart shown for the progress rate on the index screen
Limitations
- The "Progression Rate" column cannot be used in a "Record table".